Multi-Tenant Cybersecurity Application Redesign
Redesigned a multi-tenant dashboard to reduce data friction and support customizable report flows — resulting in a full platform expansion.
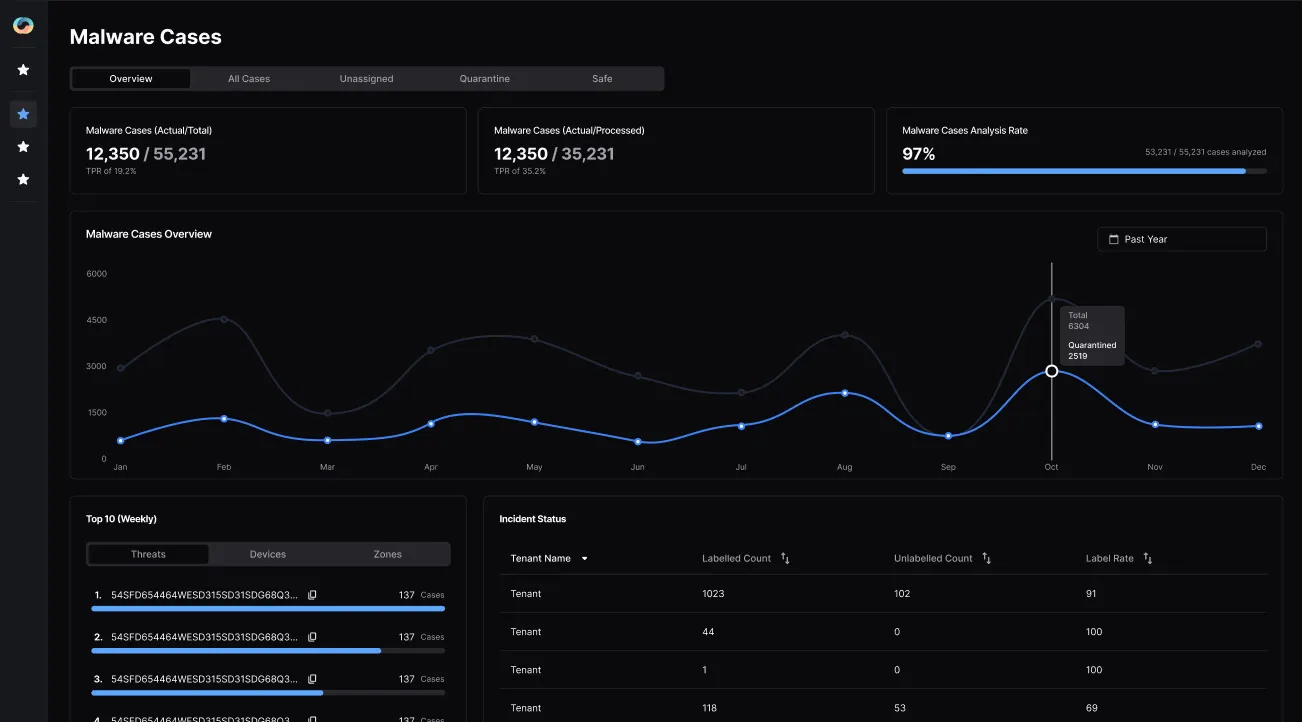
This was a two-phase redesign and feature expansion project for a multi-tenant cybersecurity application. The initial focus was on improving data clarity and usability in the existing dashboard. Once the redesigned version was well-received, the project expanded into a more complex workflow integration — including features like report generation, customization options, and client communication tools.
Context and Problem
The client’s existing platform suffered from visual clutter and unclear data presentation. Users struggled to quickly grasp key information due to poor chart selection and overloaded data tables. Additionally, their internal workflows (especially around report generation) were only partially supported by the existing UI, requiring users to rely on external tools or manual workarounds.
They were also transitioning to a new platform, offering the opportunity to rethink both UI and UX foundations from scratch.
Phase 1: Data Clarity & Scalable Dashboard Redesign
Goals
-Improve clarity in visual data representation
-Reduce cognitive load
-Design for scalability and multi-tenant use
What I Did
Replaced ineffective charts: Transformed inventory OS distribution from a bar chart to a pie chart, which better reflected categorical data proportions. Swapped the main timeline chart from bars to a stacked line chart for clearer trend analysis.
Reworked table components: Designed nested data tables to support hierarchical information and align better with the client’s workflow structure.
Introduced progressive disclosure: Used collapsible sidebars to hide secondary data until needed, decluttering the main dashboard view and improving focus.
Outcome
The redesigned dashboard provided significantly improved visibility, reduced user friction, and laid the groundwork for deeper integration of the client’s operational processes. The client approved the design direction and requested to extend the platform further.
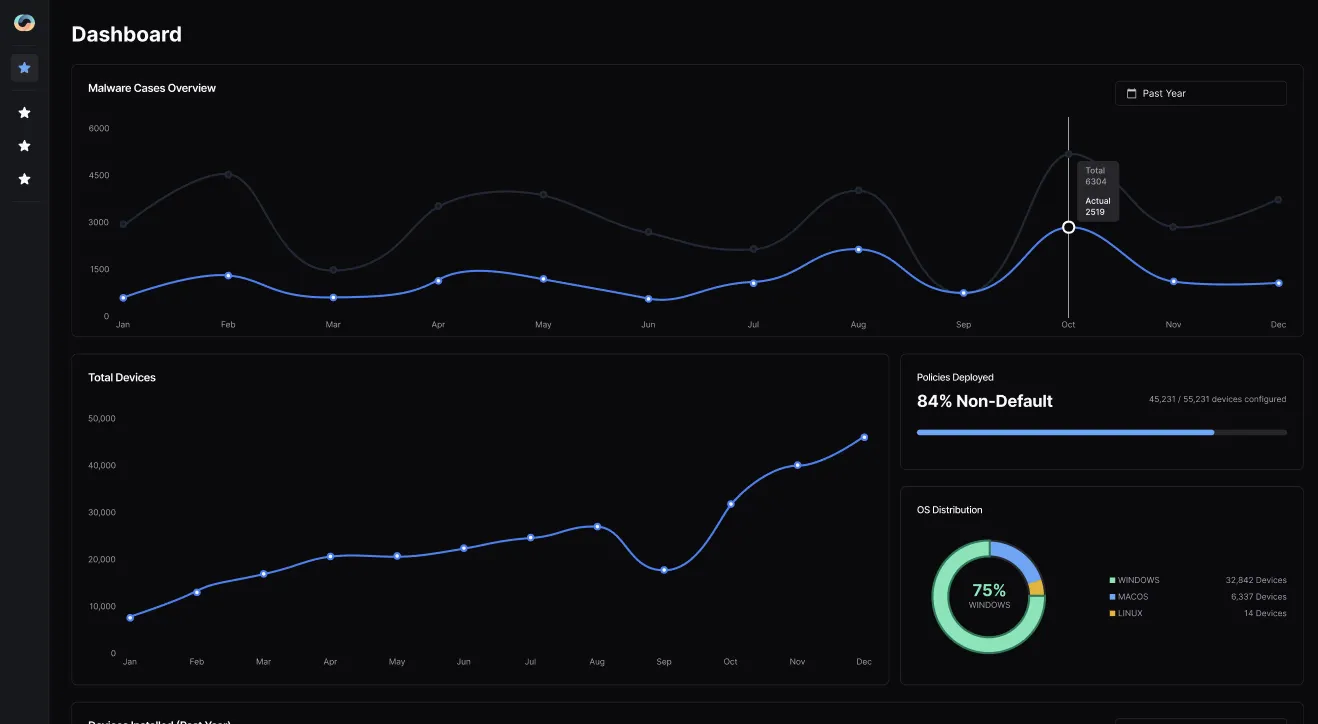 Updated Dashboard
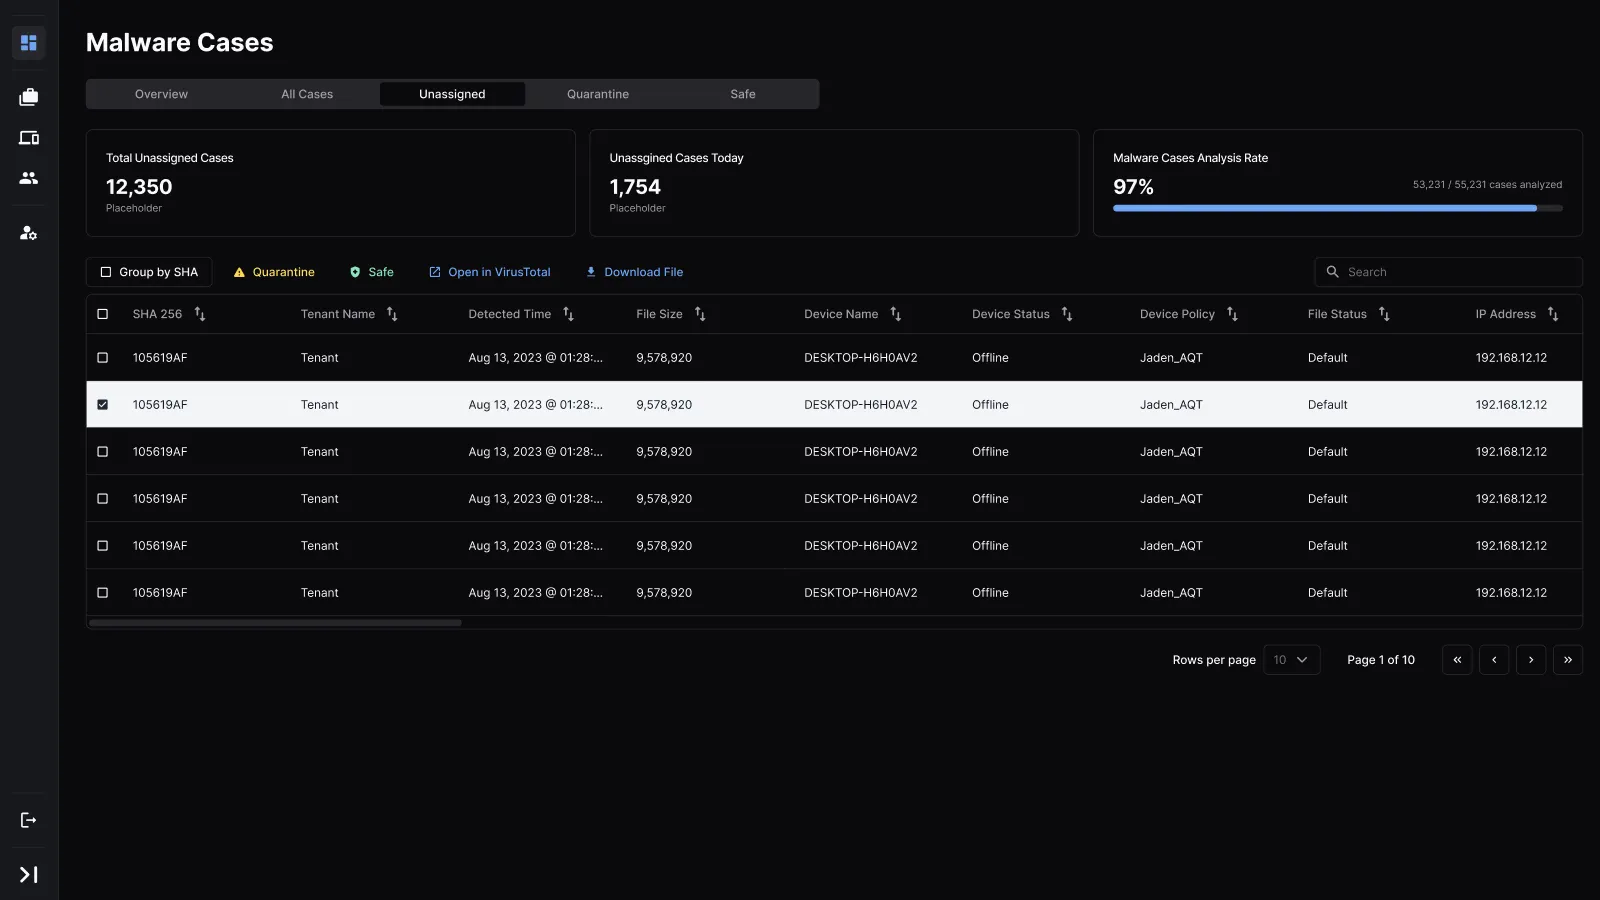 Updated Tables
Phase 2: Report Generation UX & Workflow Alignment
Goals
-Extend the platform to support full internal workflows
-Streamline complex processes (e.g., report generation)
-Align the interface with real user expectations
Key Challenges
-The report generation flow had multiple conditional branches
-Users needed the ability to send reports directly to clients
-The sequence of tasks wasn’t clearly defined or documented
What I Did
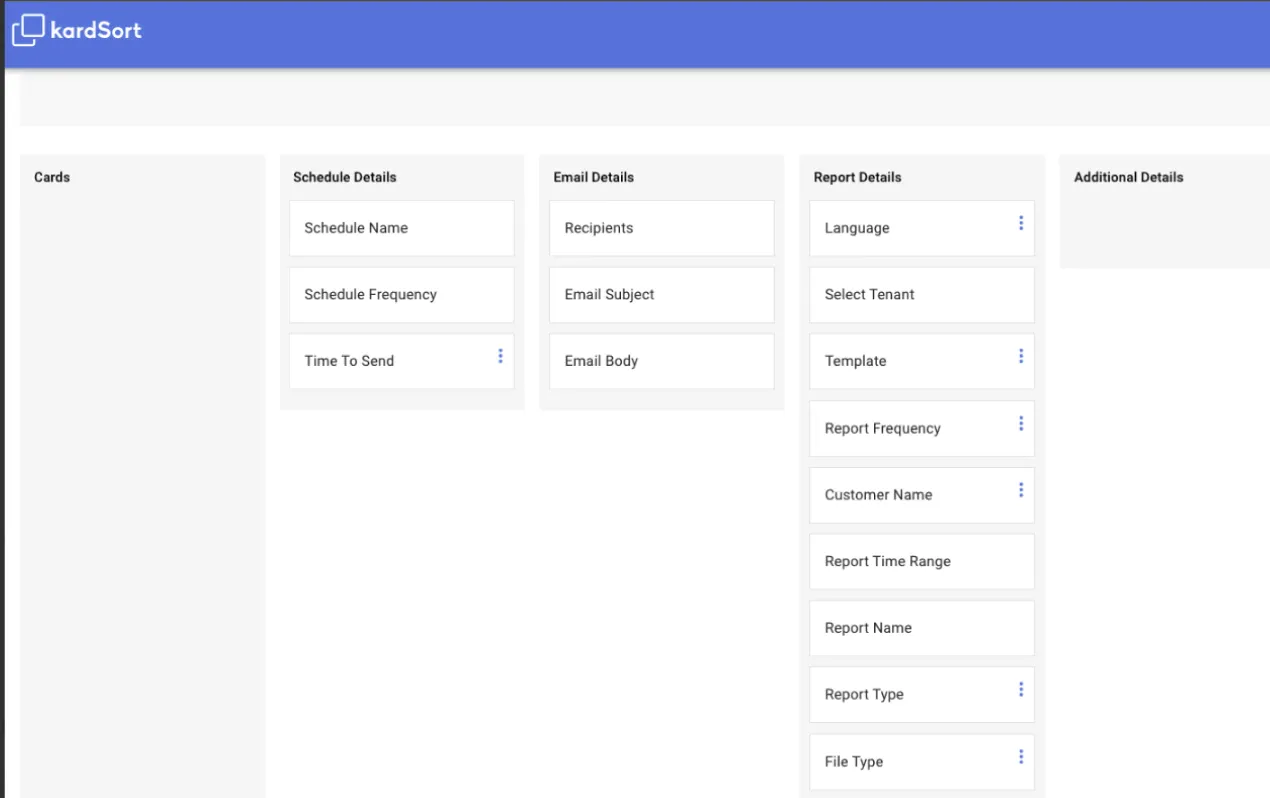
Card Sorting for Mental Model Alignment: Conducted card sorting sessions to understand how internal users mentally organized the steps in the report generation process. Used insights from this exercise to restructure the UI flow to better fit user expectations.
Decision Tree Mapping: Built a detailed decision tree mapping out every possible user path and interaction. This ensured all edge cases were accounted for and helped define branching logic.
Developer Handoff Tools: Created a visual version of the decision tree embedded with UI screens to guide developers during implementation. This reduced ambiguity and served as both documentation and implementation logic.
Client Iteration & Feedback Loops: Ran multiple design presentations to walk through interaction points and validate unclear requirements. Collaborated directly with stakeholders to finalize UI variations that required business-specific input.
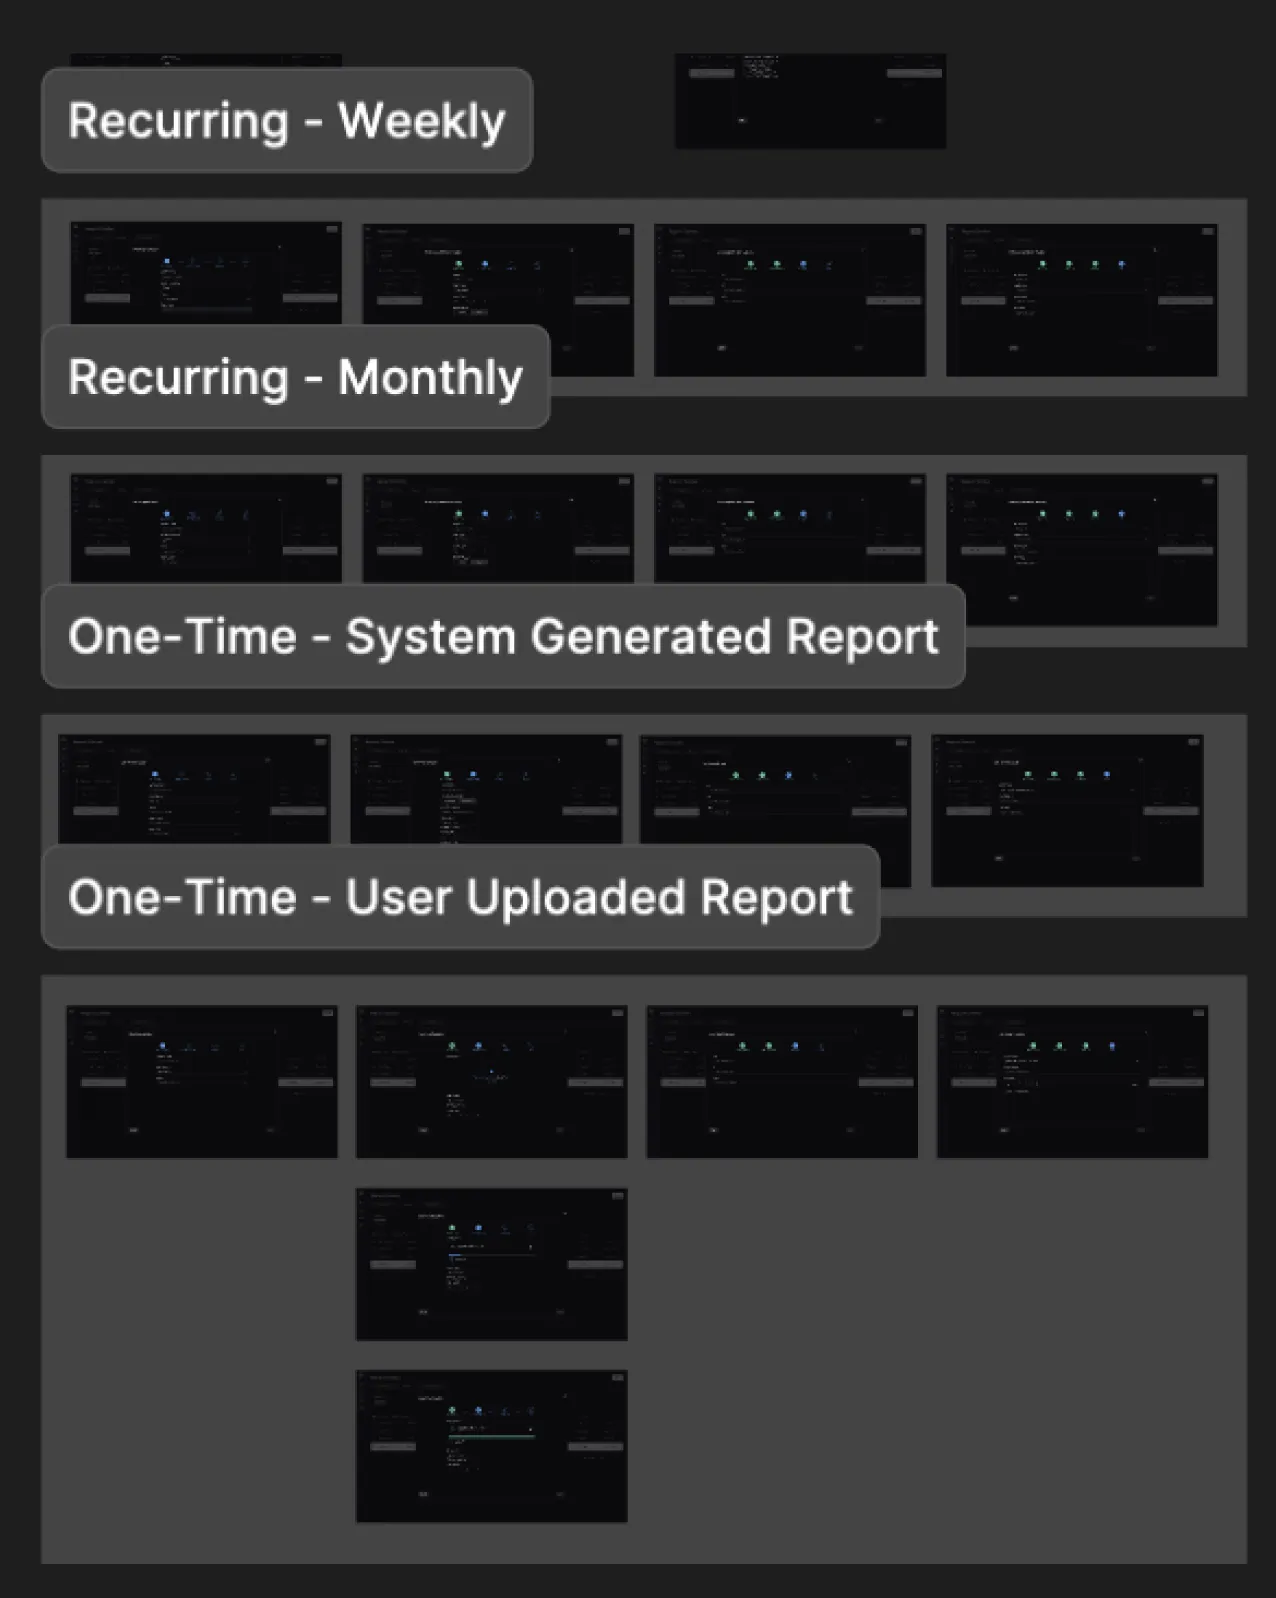 Decision Tree broken down further into individual branches.
Outcome: End-to-End Workflow Support, High Dev Fidelity
The updated platform eliminated manual workarounds, improved cognitive clarity for multi-tenant users, and enabled precise dev handoff with near-zero rework.
The use of structured design methods like card sorting and decision trees allowed for high design-to-development fidelity and minimized rework. Feedback from both the client and their end users confirmed that the design significantly improved efficiency, clarity, and usability.